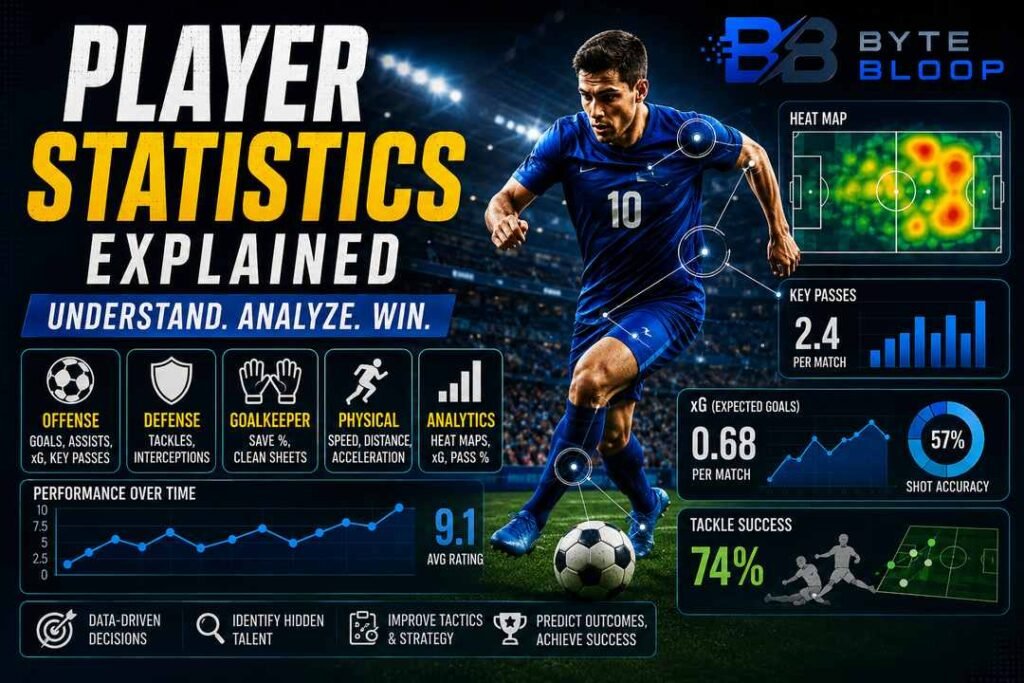
Player Statistics Explained
Introduction
In modern sports, numbers have become the new language of the game. From the minutes a defender spends marking a striker to the percentage of shots saved by a goalkeeper, every statistic offers a lens through which teams, fans, and analysts can evaluate performance. Player statistics are not just raw data; they are contextualized metrics that reveal strengths, weaknesses, and potential impact on a match’s outcome. Understanding these numbers equips coaches with actionable insights, helps scouts spot hidden talent, and empowers fans to engage more deeply with the sport. As data collection technologies advance—from GPS tracking to machine‑learning‑driven video analysis—the depth and granularity of player stats continue to expand, making it essential for anyone involved in football to grasp their meaning and application. This guide will walk you through the core concepts, explain how statistics are gathered and interpreted, and show you how to apply them in real‑world scenarios.
What Are Player Statistics?
Player statistics, or player stats, are a collection of data points that quantify a footballer’s performance on the pitch. According to SportMonks, these metrics range from basic counts like goals and assists to advanced analytics such as expected goals (xG) and heat maps that track movement patterns. Each stat tells a part of the story: a defender’s tackle success rate indicates defensive reliability, while a midfielder’s key passes reveal creative influence.
Key Categories of Stats
Offensive Metrics
- Goals and Assists – the most visible indicators of attacking contribution.
- Expected Goals (xG) – estimates the quality of a shot based on angle, distance, and context.
- Key Passes – passes that directly lead to a shot, highlighting vision.
Defensive Metrics
- Tackles and Interceptions – measure a player’s ability to regain possession.
- Clearances and Blocks – show defensive presence and threat mitigation.
Goalkeeper Metrics
- Save Percentage – saves divided by shots on target.
- Clean Sheet Percentage – proportion of matches without conceding.
Physical and Tracking Data
Modern analytics also capture movement data. Player Tracking Data in Sports research demonstrates how functional data analysis can reveal player typology by mapping speed, acceleration, and positional heat. These insights help coaches tailor training and match tactics to individual physical profiles.
How Data Is Collected
Data collection has evolved from manual sheet‑taking to sophisticated sensor networks. Wyscout, StatsBomb, and Hudl provide real‑time event data, while GPS units and optical tracking systems record every footfall. According to the 2026 FIFA World Cup guide, the tournament’s 48 teams will rely heavily on data visualisations to compare player performance across diverse leagues.
Interpreting the Numbers
Raw numbers can be misleading without context. For instance, a striker with 15 goals may appear prolific, but if those goals come from a low number of shots, the player’s efficiency might be questionable. Advanced metrics like xG help adjust for shot quality, giving a clearer picture of a player’s contribution. Similarly, a defender’s tackle success rate should be viewed alongside positioning data; a high rate in congested areas may indicate tactical discipline.
Applying Stats in Decision‑Making
Coaches use stats to shape tactics. A midfielder’s high pass completion rate in the final third suggests a team can build play from the back. Scouts employ metrics to identify undervalued talent; a winger with a high dribble success rate but low goal output may still be a valuable playmaker. In the NBA, a 2026 guide highlights how shot data can predict winning, underscoring the cross‑sport applicability of advanced analytics.
Future Trends
As machine learning models become more sophisticated, predictive analytics will shift from descriptive to prescriptive. Real‑time decision support systems may advise substitutions or tactical changes during a match. Additionally, functional data analysis is expected to refine player typology, enabling more personalized training regimens.
Key Takeaways
- Player stats quantify performance from basic counts to advanced analytics like xG and heat maps.
- Context matters—raw numbers can mislead without situational data such as shot quality or positioning.
- Coaches and scouts use stats to tailor tactics, identify talent, and predict outcomes across sports.
- Emerging technologies, including GPS and machine learning, are pushing analytics toward real‑time, prescriptive insights.
- Understanding player statistics empowers teams to make data‑driven decisions that improve results.
Frequently Asked Questions
What is the difference between basic and advanced player statistics?
Basic stats include goals, assists, and minutes played, while advanced stats such as expected goals, key passes, and heat maps provide deeper insight into performance quality and context.
What are the key features of modern player tracking systems?
Modern tracking systems use GPS and optical sensors to record movement, speed, acceleration, and positional data, enabling detailed heat maps and functional analysis.
What are the best use cases for player statistics in coaching?
Coaches can use stats to design training drills, adjust tactics, and make substitution decisions, all based on measurable performance indicators.
What are the pros and cons of relying heavily on data in sports?
Pros include objective decision‑making and talent identification; cons involve potential over‑reliance on numbers that may overlook intangibles like leadership and psychological resilience.
Conclusion
Based on the available information and industry analysis, player statistics provide a comprehensive framework for evaluating performance, informing tactical decisions, and uncovering talent. By integrating basic metrics with advanced analytics and contextual data, teams can move beyond surface numbers to gain actionable insights that translate into on‑field success.
Related Reading
- How to Read a Football Heat Map
- The Rise of AI in Sports Analytics
Sources & References
- New to the World Cup? Here’s a Guide to Understanding it …
- Explaining the data visualisations in Stars of Soccer …
- Comprehensive Football Stats Guide | PDF
- Player Tracking Data in Sports
- Player statistics
- How to Understand NBA Stats: A 2026 Playoff-Era Guide
- What Decides a Match Beyond the Scorecard? | EP1
- Football Analytics Tools: What I Actually Use in 2026